
marlies Pöschl
vienna, austria
artist & filmmaker
“In 2020, our everyday life has given way to a new normality, impacted by the curve of COVID-19 infections. Statistics have become the lens through which our governments look at when making decisions that influence millions of people on a daily basis. What life realities have not been accounted for in this new normality?”


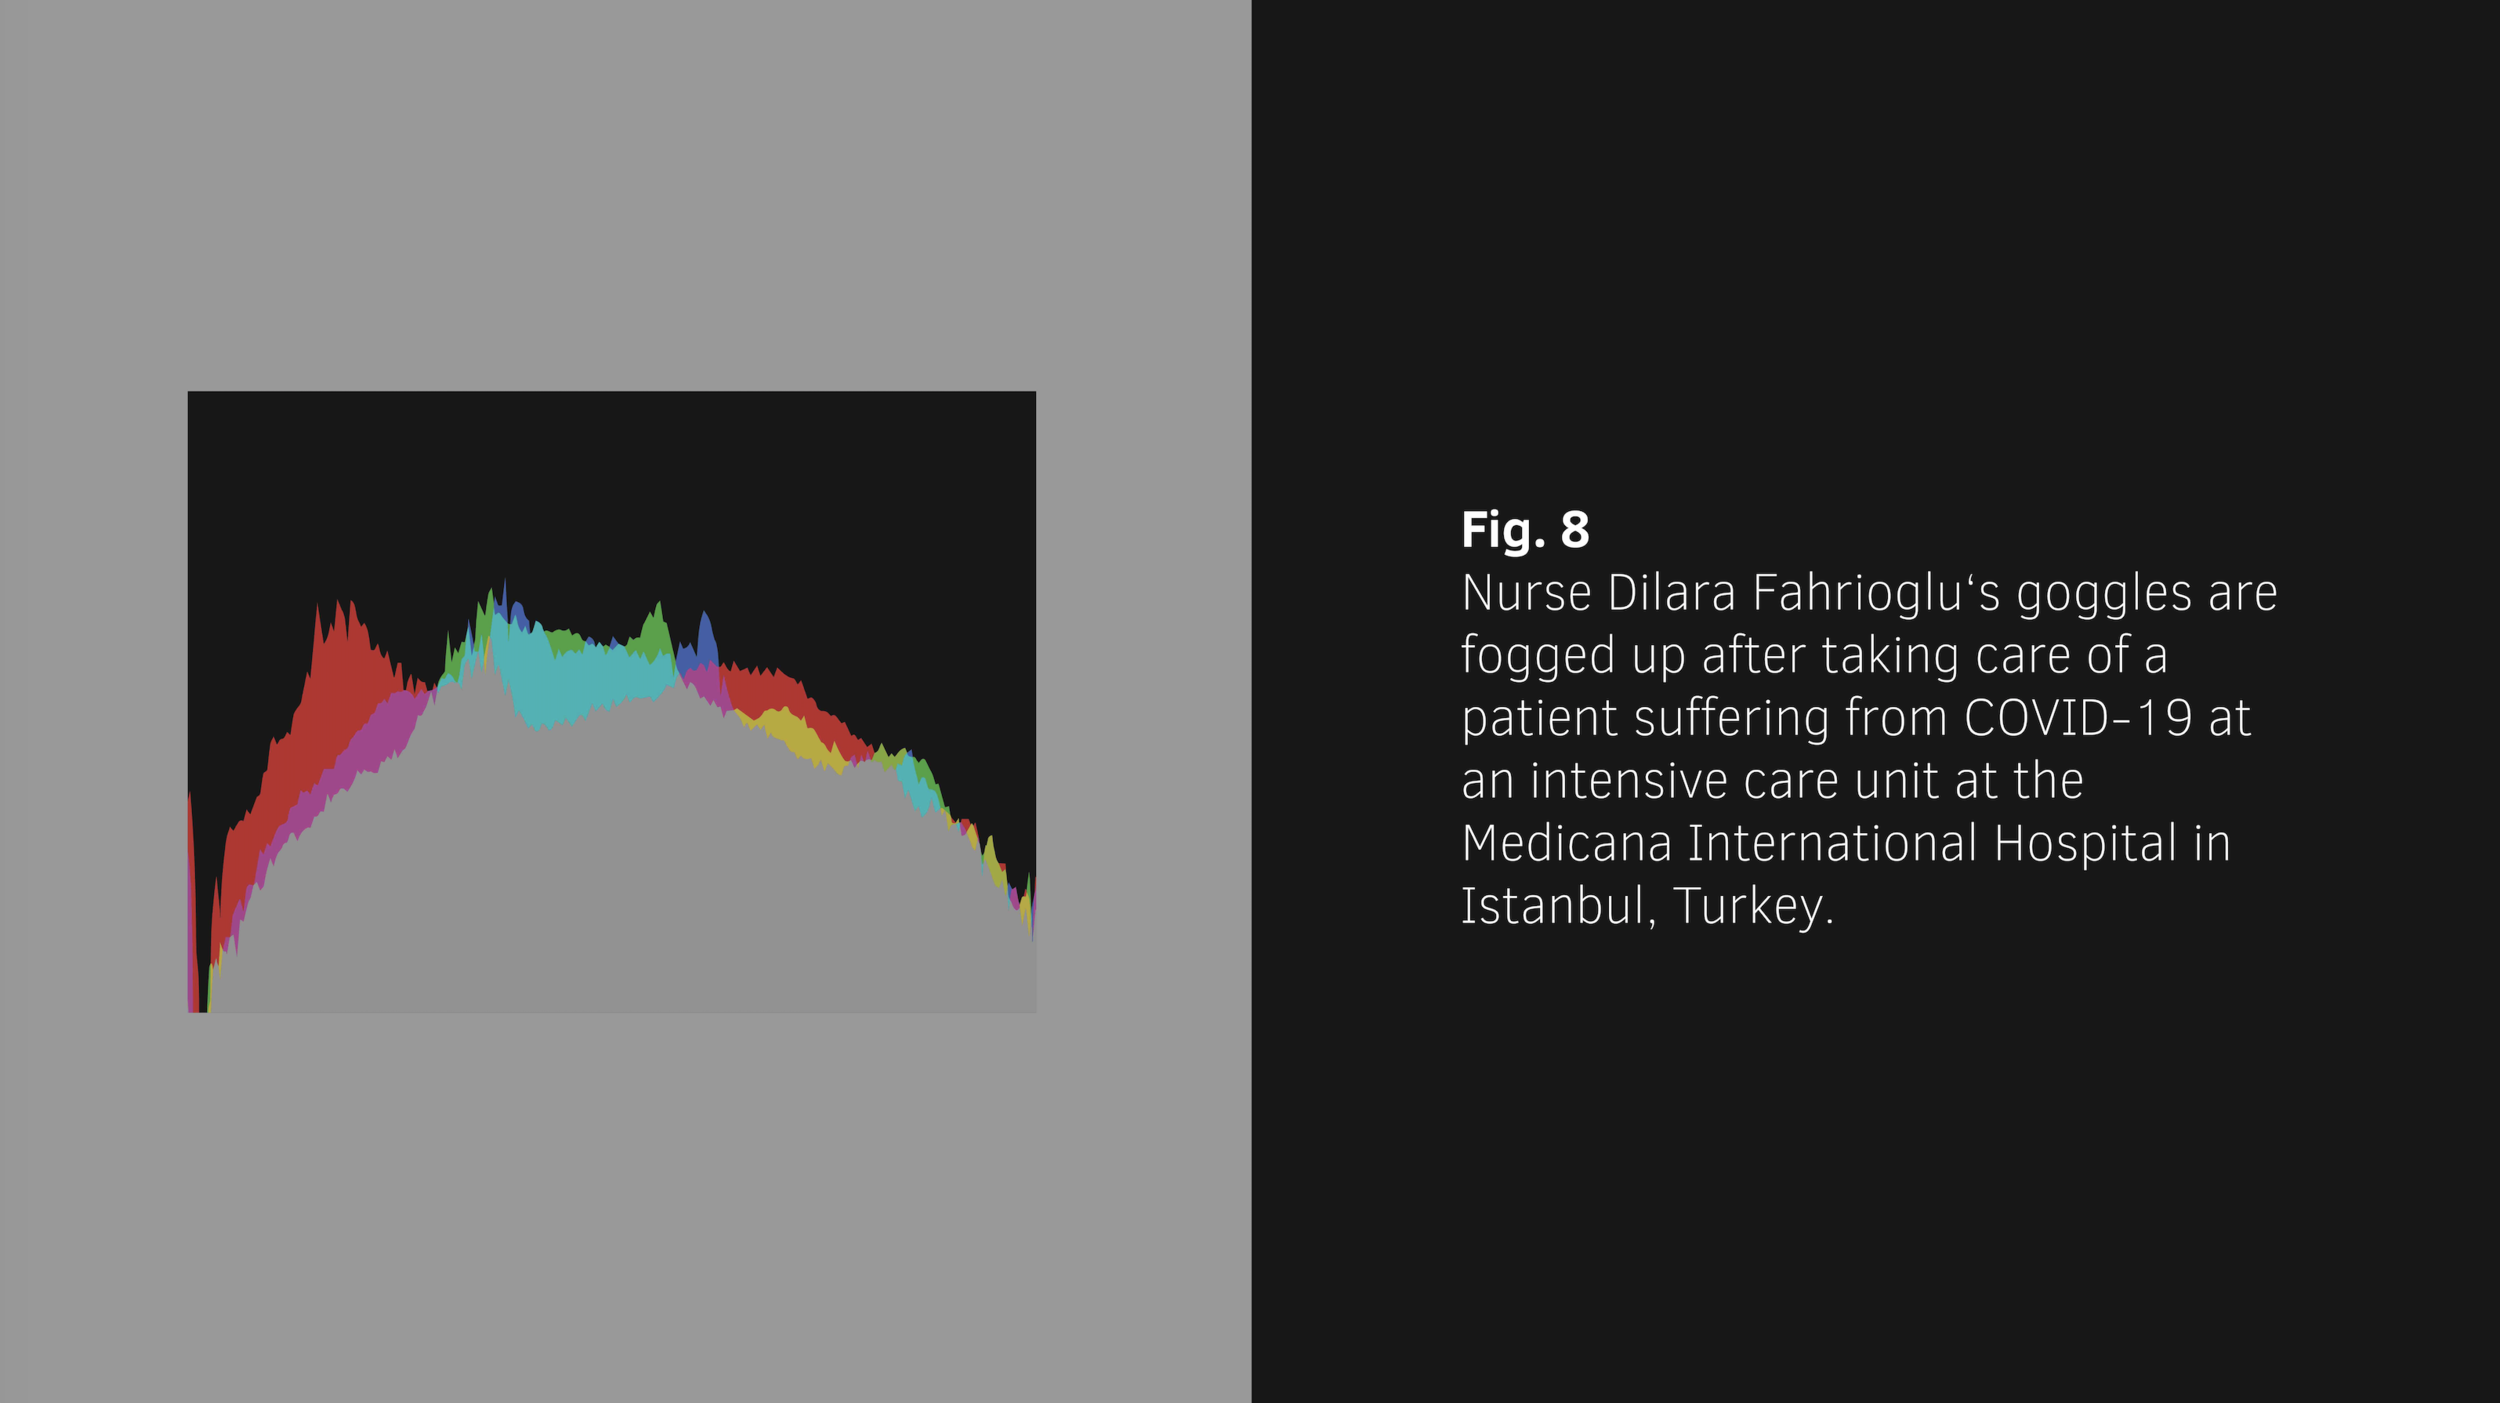


Marlies Pöschl, A Curve for Critical Infrastructure, 2020
What is normal? In his book, “Seeing Like a State” (1998) James C. Scott discusses how states develop categories in order to make things legible – citizens are being classified in order to make them easier to manage.
This series of images is based on Lumetri histogram curves of color photographs depicting workers active in critical infrastructures around the globe during the pandemic. Those curves normally used in color grading read the brightness and tonal values of the image. The pictures were taken from a Reuters newsfeed in the week of the 16th to 23rd of April 2020. Transforming the manifold essential activities of those individuals during the COVID-19 crisis into color values, A Curve for Critical Infrastructures translates the value of reproductive and caring labor into abstract shapes and we are left to guess the colors, light and darkness present at that moment. An absurd attempt to hold on to what is critical — and incomputable.